Report template
You can create forms and reports with a visual interface or using advanced tools like GraphQL queries, HTML code, and cascading style sheets (CSS).
Create a custom form or report
This method uses a visual interface and does not require advanced knowledge of HTML or other tools. If you're creating a report with line data like sales or purchase order lines, see the following section in grouping data.
- Select Create.
- This opens to the Basic details tab where you begin by entering a unique name for your template. The name cannot have spaces or special characters.
- Select a Report from the dropdown menu. The report you select includes any variables for that report. For example, if you select purchaseOrder, you have the option to enter a specific purchase order number as a variable in a later step. You can also customize data and other settings in the next steps.
- Settings like Definition locale and Default paper format are optional at this point. You can add them later.
- You can proceed to the Template tab without saving, but it's best to save as you progress.
Add data
On the Template tab you can select, filter, and sort the data for your report. See the section below for layout options.
- Select the folder symbol to display the Fields panel. This panel displays the data you can add to your template including any Custom fields that you created. You can add custom fields to your forms and reports.
- When you select data, you can choose a Table or a Data container. A table provides a list of records. The data container displays a main record, with additional records if needed, based on settings for filters and sorting. Within a data container, you can insert a table from the toolbar to customize how your data displays.
See What do the different icons mean in the Fields panel? for more information. - A wizard guides you through the process of defining filters and sorting data. The table wizard gives you the additional option of selecting columns and grouping data.
- When defining filters, you have the option to Use parameter. When switched to On, you can filter a specific property on a value such as order number, date, and so on.
- Data displays in the Preview panel and updates while you work. Select Preview if you don't see it. And select Extend preview for a full-page view and the option to print to PDF or a connected printer.
Group data and add totals
If you're creating a report with line data like sales or purchase order lines, you can group table data that features key metrics like minimum, maximum, sum, average, and count. To do this, you need to add data as a table, step 2 above.
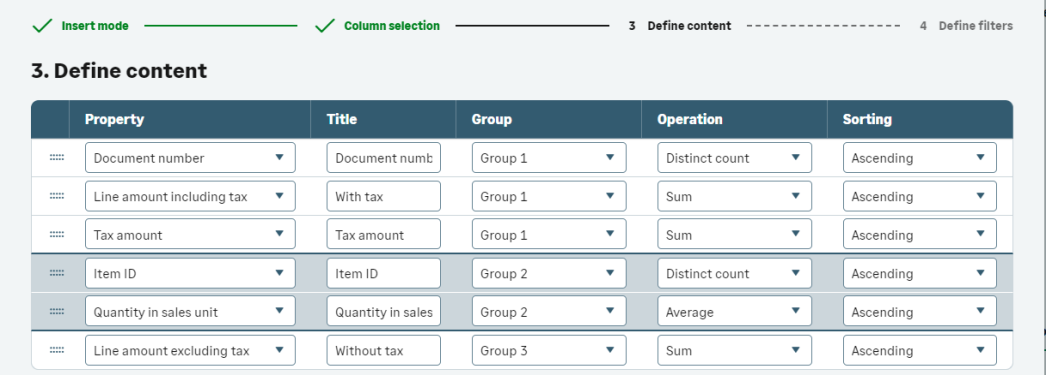
When you get to the third panel, Define content, in the wizard, you can begin to group your data and select an operator like sum, average, distinct count, and so on, for lines.
The image below shows an example of how you can group data and add metrics.
Important points
The Title column displays a custom name that is different from the property name.
Groups display in numerical order. You can have more than 1 property per group.
The Document number operation can only be Distinct count.
Sums and averages are labeled Group 1 footer, Group 2 footer, and so on, in the visual editor.
The last group simply displays Footer.
Working with variables
Whether you're building a list report template, a form, or a report, you can use variables to refine data for a specific report generation. When you add a variable, you need to generate the form or report without saving. Saving removes the variable.
Variables are defined when creating a template.
Layout and design options
This section describes the various layout and design options you can use when building a custom form or report. You can do this on the Template tab.
Basic formatting options
Start by displaying the Formatting panel from the toolbar, which displays options and settings related to elements in the template.
Highlight an element like a table or data container to see your options.
If you added a table for data, the Formatting panel displays for alignment, background and border colors, styles, and you can modify columns.
If you added a data container, use the Formatting panel to modify sorting and filters.
If you did not define a locale or a paper format, you can do this on the Settings tab in the Preview panel. The paper format refers to standard paper sizes and affects how your template displays and prints.
Editing toolbar
The Editing toolbar is part of the rich text editor and provides standard options for text and other elements in your template. For example, you can insert an image, like a company logo, using the Insert image button. You can change fonts, insert a table, and so on.
From the toolbar, you can also insert:
Document properties
When you select this option, you can insert dynamic content such as the current date, who generated the report, and so on.
If your cursor is in the header or footer section, you can insert the page number and the total number of pages.
Unbreakable container
When you insert an unbreakable container, the data within the container displays on the same page. For example, if you had the container toward the lower part of the page, the container would begin at the top of the next page if the contents don't fit the current page.
Headers and footers
You can enter content for headers and footers directly in the design area. Remember that the content you enter displays on all pages.
In addition, you can insert document properties like page number and total number of pages, as described above.
Move or remove elements
Elements can be moved within their original blocks. You cannot move a data field from one data container to another or from a table to a data container.
Select an element. This changes to border color from yellow to blue. You can drag it to a new location, add a carriage return, or delete it.
Header and footer tab
This tab only displays when you build an advanced, HTML template.
You can enter a header and/or a footer that displays on every page of your template. Select Preview to update the Preview panel to see your text.
Attachment tab
The content for this topic is still in progress.
We will make the content available as soon as we can. Your patience is appreciated.
Translation tab
If you need to use your custom template in another language, you can enter the translated text for plain text you entered in your template.
The Translation grid displays one line for each line of plain text you added to your template.
- For the desired language, for example French, enter the French equivalent in the Target column.
- Enter translated text for each line and in each language you need.
- To see the translated text in your template, in the Preview panel, change Preview locale on the Settings tab to the desired language.
Advanced report: Convert to HTML
When you select Convert to HTML, you have 2 options:
Create HTML copy of your template. You can continue editing in the visual interface and you can work directly in the HTML code version of your template. This option gives you 2 versions of the same template.
Convert takes you out of the graphic interface. You can only work on your template using advanced tools like data queries, HTML code, CSS, and so on.
- After creating a template, such as myPackingSlip, select Convert to HTML.
- Select the option to Create HTML copy.
- You are back to the Basic details tab, with a different set of tabs.
- The name would be myPackingSlip1, but the rest of the field values default from the original template.
- On the Data query tab, you can see queries in GraphQL to add data.
- On the Code tab, you can add code to sort, filter, or add conditions to your data.
- Use the HTML template tab to modify the layout using standard HTML code.
- You can update and customize further on the Style sheet tab using standard CSS code.
Working with templates
This section answers basic questions and provides step-by-step examples.
How do I generate and print a form or report?
What do the different icons mean in the Fields panel?
How can I create a custom form?
How can I replace the standard form in the print options on a document record?
Why can't I use spaces in my template name?
How do I generate and print a form or report?
Select Generate to run the report based on the data you selected. When complete, there is an alert in the Notifications center. From the Notifications center, you can view and download your document.
If you want to view the document first, select Extend preview and then select Print. This opens a print dialog box where you can select from standard print options.
What do the different icons mean in the Fields panel?
Different icons for data listed in the Fields panel signal type of data. It's important to understand their meanings when adding data to your template.
-
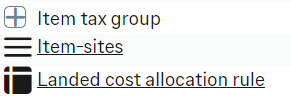
The Plus sign icon means you can expand that group to see more data. You cannot add this type of data. You need to expand until you see one of the types below.
-
The Lines icon means this is a collection of data. Use this data type to include lines for purchase orders, sales orders, invoices, and so on.
You can only add this data if your cursor is already in a data container. When you select a collection, you need to decide whether to add it as a nested table or another container.
When you add lines data, the data available in the Fields panel updates to reflect your selection.
-
The Block icon represents a single property. If your cursor is not already in a data container or table, you need to decide whether to add this property as a table or data container. If you want to include this property to an existing table or data container, selecting this property adds it to where your cursor is located.
How can I create a custom form?
Sage provides standard forms that you can print from any document record. While this format is efficient, you might want something different for your business.
These steps explain how to create a new packing slip form to replace the standard form delivered by Sage.
- Select Create and enter a unique name, remember not to use spaces or special characters.
- In the Report field, select packingSlip. This report type has a parameter associated with it that you can see in the Variables tab of the Preview panel.
- Enter the shipment number from the open record into the Value field on the Variables tab. This pulls and displays data for that shipment in the preview area.
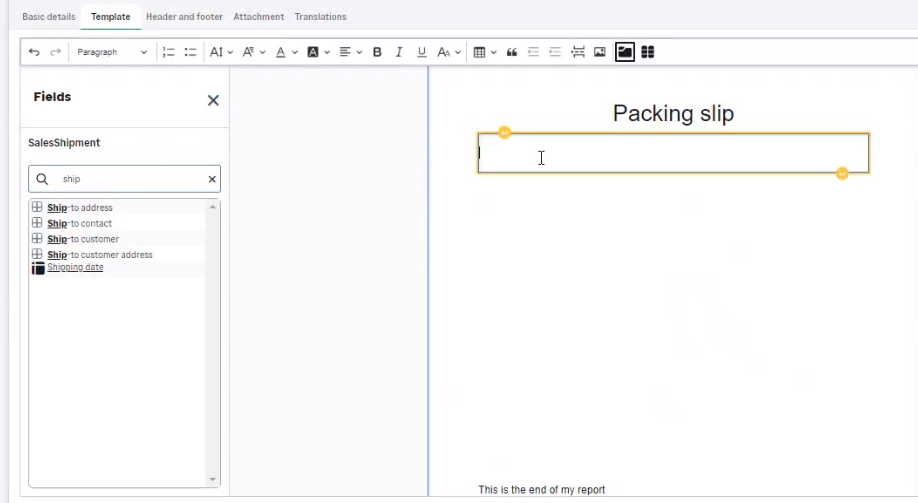
- Start by entering a title and any other text you might want to add. You can change the font, the alignment, the color, and so on.
- Now, you can add data. Open the Fields panel and type ship in the search bar.
- Select Sales shipment and select Data container in the Insert an object type wizard.
-
Because we are creating a packing slip for a single record, add filters as follows:
-
Property: Number
-
Filter type: Equals
-
Use parameter: ON
-
Filter value: shipmentNumber
-
- We're only displaying 1 record, so there is no need to sort.
- Select Confirm to return to the editor.
- You see the data container under the title. The Fields panel displays data for that container.
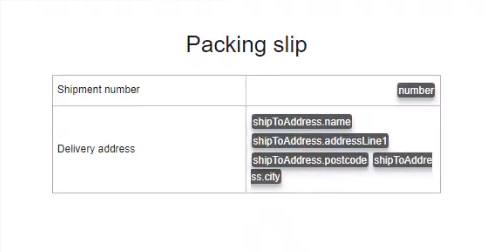
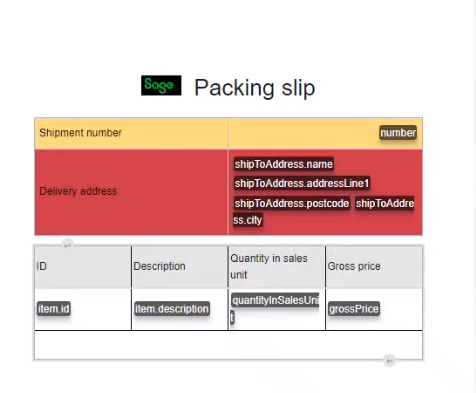
- With your cursor inside the data container, add a 2-column, 2-row grid using the Editor toolbar.
- In the first column, enter Shipment number in the first row and Delivery address in the second row.
- In the second column, select the related data for each row. Remember, the editor displays the property names; the actual data displays in the Preview panel.
- Add a logo and change around the colors of your table.
- Now, let's add shipment lines to the packing slip.
- With your cursor still inside the data container, search for Lines in the Fields panel. Lines has a different icon. This means it is not a single property, but a collection of data.
- Select Lines then Table for the object type.
- Select columns like item ID, description, gross price, and quantity in sales unit.
- Sort your columns and decide the number of decimal places.
Here's a view from the Preview panel. Notice that the layout and colors are the same as the editor window, but the preview displays the actual data.
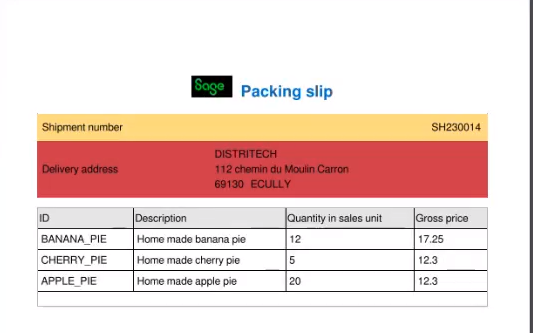
You can continue to add data, such as allergens for these food items, and refine your layout.
When you're done, save your template.
How can I replace the standard form in the print options on a document record?
First, create a new form, such as a packing slip described above. Using that as an example:
-
On the Report page, select packingSlip from the main list.
-
In the packingSlip record, in the Active template field, select your custom form from the list.
-
Save and go to the Sales shipment page.
-
Open a sales shipment record, select Print.
-
You see your new template applied to the packing slip document.
Why can't I use spaces in my template name?
Template names use a naming convention called camelCase, where you can use upper or lowercase words but no spaces or special characters. If you decide to apply APIs to any of your templates, the name in this format is already compliant with the necessary syntax.